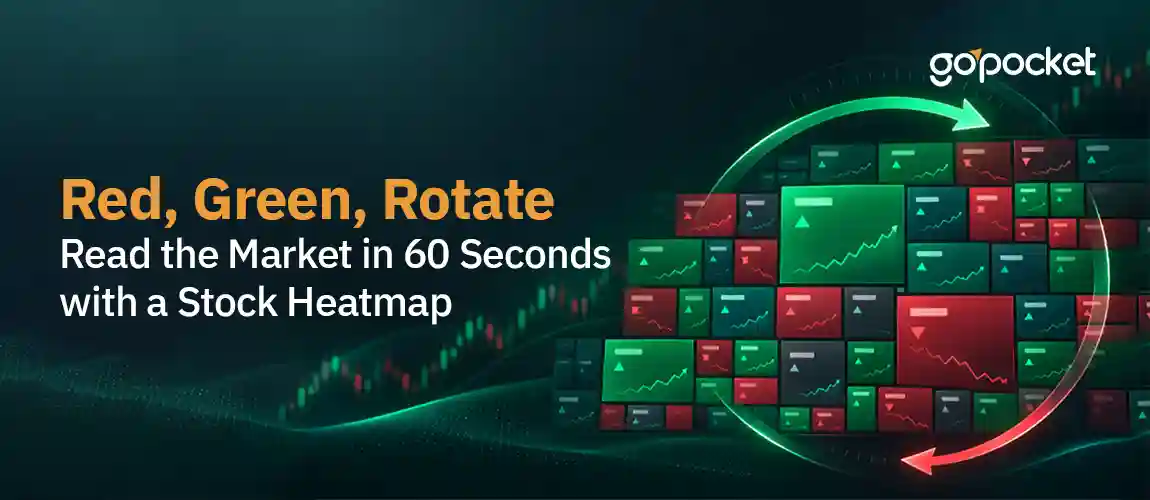
RED, GREEN, ROTATE:
READ THE MARKET IN 60 SECONDS WITH A STOCK HEATMAP
Pilots don't read every instrument on their dashboard one by one before deciding how a flight is going. They glance at a handful of colour-coded gauges, and in two seconds, they know whether everything's fine, something needs attention, or it's time to act. A stock market heatmap works the same way, except the dashboard is the entire market, and the glance takes about sixty seconds.
If you've ever opened a trading app and seen a grid of coloured boxes, different sizes, different shades of red and green, scattered across the screen, you've seen a heatmap. Most people glance at it, feel vaguely informed, and move on without ever learning to read it. That's a shame, because once you know the logic behind it, a heatmap tells you more about the market's real mood in one glance than twenty minutes of scrolling news headlines.
WHAT A HEATMAP ACTUALLY IS
A stock heatmap is a treemap, a grid of rectangles where every company gets one box. Two things decide what you see.
Box size represents market capitalisation. A company's market cap is its share price multiplied by its total shares outstanding, essentially how large the company is in rupee terms. A bigger box means a bigger company, which means that company's price move carries more real-world weight in the overall market, not just more visual space on your screen.
Colour represents the price change, and the shade represents the size of that change. Green means the stock is up for the day, red means it's down, and the intensity matters just as much as the hue. A pale green box is up a little. A deep, almost neon green box is up a lot. The same scale works on the red side, pale pink is a small dip, deep red is a sharp fall.
Put those two signals together, and you get something genuinely powerful: not just which stocks moved, but which moves matter, because a 3% move in a company worth Rs. 5 lakh crores shake the entire index far more than a 3% move in a company worth Rs. 5,000 crores, even though both show up as identically sized colour changes if you were only reading percentages off a list.
WHY SIZE AND COLOUR TOGETHER BEAT ANY SINGLE NUMBER
Here's the exact problem a heatmap solves. If someone tells you, “The Nifty is up 0.5% today," that single number is a weighted average, and averages hide more than they reveal. The index could be up because literally everything rose a little. Or it could be up because two or three massive companies rallied hard while most of the market fell. Those are two completely different market moods, and the index number alone can't tell them apart.
A heatmap resolves this instantly. If you see a handful of large boxes glowing deep green surrounded by a sea of small red and pink boxes, you're looking at a narrow, mega-cap-driven move, not genuine broad strength. If instead you see mostly green across boxes of every size, small, medium and large alike, that's broad-based buying, a far healthier signal for the market.
SPOTTING SECTOR ROTATION IN REAL TIME
This is where the heatmap goes from "interesting picture" to "genuinely useful tool." Most heatmaps group stocks by sector, banking together, IT together, auto together, pharma together. This grouping is exactly what lets you see sector rotation, money moving out of one part of the market and into another, often before it shows up clearly anywhere else.
Here's a real, current example. In the week leading into mid-November 2026, Indian markets showed exactly this pattern. PSU banking stocks turned a deep, uniform green, state-run banks rallying together on strong quarterly results and renewed consolidation talk. At the very same time, IT, Auto and Metals clusters sat in noticeably duller or reddish tones, pressured by a hot inflation print that revived concerns about an interest rate hike.
| WHAT YOU'D SEE ON THE HEATMAP | WHAT IT MEANS | WHAT TYPICALLY DRIVES IT |
| An entire sector cluster uniformly deep green | Genuine sector-wide buying, not one company's news | Strong earnings across the sector, a policy tailwind, or a macro trend favouring that industry |
| An entire sector cluster uniformly red | Broad sector-wide selling pressure | A shared headwind, rising rates, a cost pressure, or weak demand hitting the whole sector at once |
| One large box glowing bright green inside an otherwise mixed sector | A single stock-specific story, not sector sentiment | Company results, a big order win, or news specific to that one business |
| Yesterday's red sector turning green today | Active rotation, money flowing into that sector right now | Investors repositioning, often ahead of the move becoming obvious in individual stock charts |
That last row is the one worth watching most closely, because rotation often shows up in the heatmap's colour pattern before it's visible anywhere else. By the time a headline says, "banking stocks rally," the heatmap had already been quietly turning green, box by box, for a day or two.
YOUR 60-SECOND DAILY ROUTINE
Here's exactly how to use this, built into something you can actually do every single morning without it eating your day.
Second 0 to 15: Take in the dominant colour. Is the whole grid mostly green, mostly red, or a genuine mix? This alone tells you whether today a broad macro day is or a scattered, stock-specific one.
Second 15 to 35: Scan sector by sector. Which clusters are uniformly coloured, and which are mixed? A uniform cluster tells a sector-wide story. A mixed cluster, some green boxes next to red ones in the same sector, usually means individual company news is driving things more than any broad trend.
Second 35 to 50: Check the big boxes specifically. Are the largest boxes, the heavyweight companies, moving with the rest of the market or against it? When a few giant boxes move opposite to everything else, that's often the real story behind a confusing index number.
Second 50 to 60: Compare today's colours to yesterday's, if you remember them. This is the step that catches rotation. A sector that was red yesterday and is green today is money moving in, right now, while it's still happening rather than after it's already old news.
Do this once in the morning after markets open, and once again before you close your trading app for the day. Two glances, two minutes total, and you'll genuinely understand more about where the market's energy is flowing than most people get from an entire evening of financial television.
WHY THIS SKILL IS WORTH PASSING ON
A heatmap rewards pattern recognition over effort. You don't need to read twenty company results or scroll through an hour of news to understand what moved the market today. You need sixty seconds, a grid of coloured boxes, and the simple logic of size and shade that this blog just walked you through.
The next time someone asks you why the market moved the way it did, you won't need to guess. You'll glance at the heatmap, see which sector clusters lit up together, and know.
Whenever you're ready to put this 60-second habit into practice, the GoPocket mobile app is right there to help you read the market immediately, every single day.